
In an increasingly complex world the password to overcome the various obstacles is SIMPLICITY.
Very often it happens that we adopt cumbersome systems and methods that make our life even more complicated, rather than making it simpler.
Today I want to show you how the new powerful interface of the MULTICENTER helps you make your life easier!
The goal of the new interface is the use of TECHNOLOGY where the word TECHNOLOGY, if well applied, must respond to the following sentence
TECHNOLOGY: SIMPLIFY COMPLEX SYSTEMS
Now I’ll explain how this idea was born to develop a revolutionary interface.
Before starting to design this new interface, we partnered with one of our customers where we asked to see for a week all the movements and operations that the operator performs.
After collecting the first data, to follow, there was a meeting with the operators, during which we agreed to map machine maintenance operations on an Excel sheet.
Once the data collection was completed, all the actions taken by production personnel and maintenance personnel were organized in an organic way, giving priority based on the frequency of operations.
We noticed that the operators took some time to check the following topics:
-
CHIP EVACUATION SYSTEM
-
TOOL CHANGE
-
STATE OF THE SATELLITE TABLES
-
MODULES OF LUBRICATION SYSTEM
-
SETTING OF OPTIONAL ACTIVATIONS AND TIMING
-
SEARCHING THE MANUAL FOR ISO INFORMATION
THESE OPERATIONS CAUSE A LOSS OF PRECIOUS PRODUCTION TIME!
Let’s go in order, I’ll explain in detail – one by one – these points and how they were solved through the new interface.
CHIP EVACUATION SYSTEM
The staff was busy intervening on the chip evacuation system and high pressure system to understand how to keep it efficient and, in the event of a halt, identify the possible cause, but, unfortunately, this second phase had sometimes long times.
To make the system simple and quick to the operator, more sensors were implemented and a graphic synoptic was developed to give the operator real-time view of the situation without having to move from the machine panel, and here is the result below.
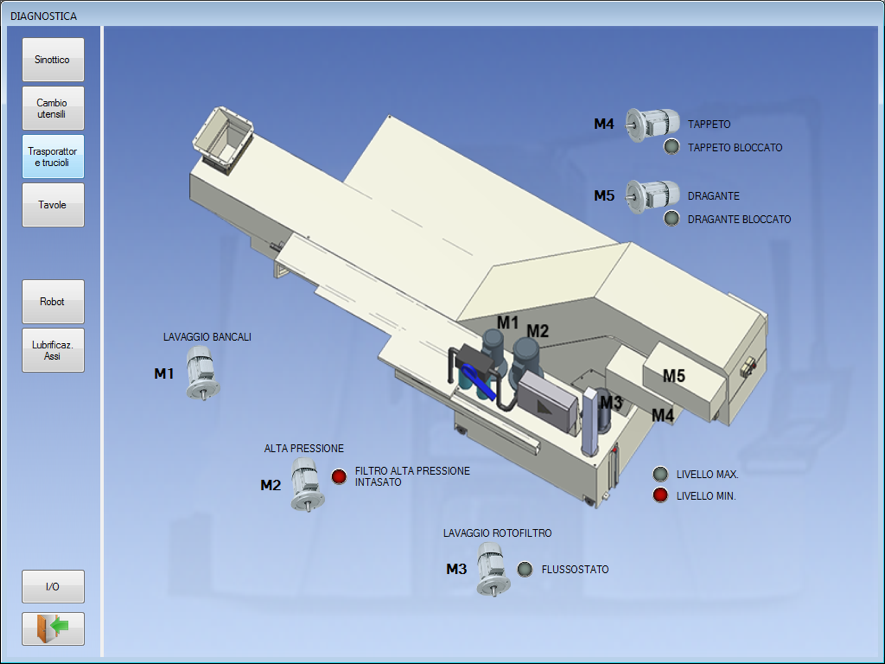
As you can see from the chart above, without going to search around the machine the causes, directly from the main panel, you can understand exactly the status of the chip and high pressure evacuator system.
STATUS OF TOOL CHANGE
Another point for which the operator takes precious time are the tool changers of the 3 modules.
Here too we have developed a graphic synoptic with the same logic so as not to force the operator to look around the machine for the limit switch status or to look inside the electrical cabinet for the signal to understand the status.
In addition to the various signals, there is also a CYCLE CHANGE TOOL counter (see bottom right), which monitors the status of the tool gripper spring because it must be inserted in the preventive maintenance plan, avoiding machine stops at the last moment without notice.
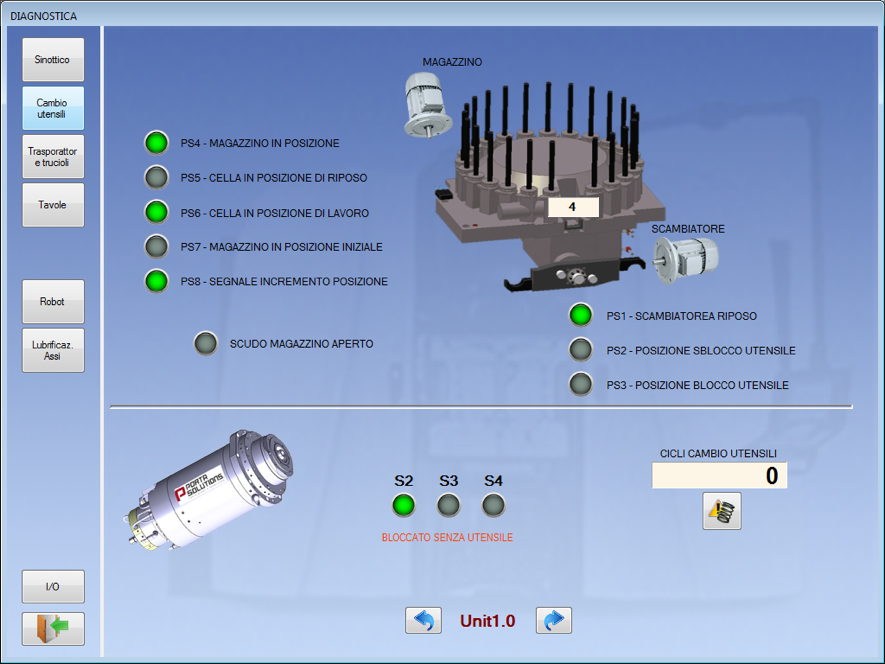
As you can see, this screen is dedicated for each module, in fact at the bottom, see that the module 1.0 is now selected, you notice the green dots that indicate the active limit switch status (ON), while the off ones indicate the OFF limit switch status .
STATUS OF SATELLITE TABLES
Going forward with this approach, we also analyzed the 4 satellite tables and the main pallet.
As you will see below in the image, for each satellite table there are two solenoid valves with relative limit switches. The first solenoid valve is that which manages the engagement of the table rotation system once it has arrived at the station, the second one manages the hydraulic clamping table brake.
At the bottom you can find the main pallet changer with its hydraulic lock / release valve.
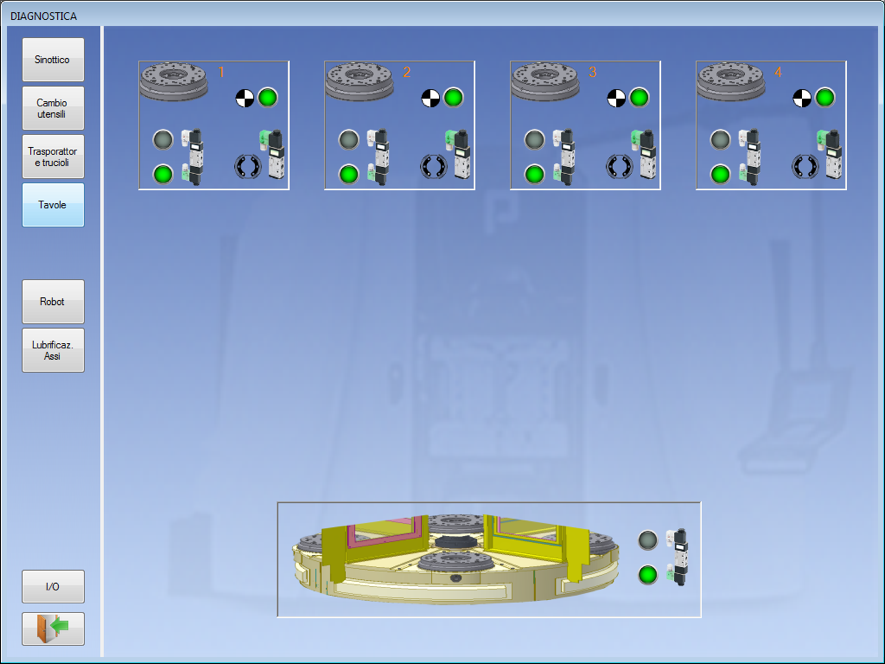
As you can see everything is very intuitive and, once again, there is no need to access the affected areas by dismantling the machine and wasting time to understand the status of the limit switches.
MODULE LUBRICATION SYSTEM
Also, the centralized lubrication system has been made graphically simple using digital pressure switches, so as to realize if the lubrication lines are working at their best and are full of oil.
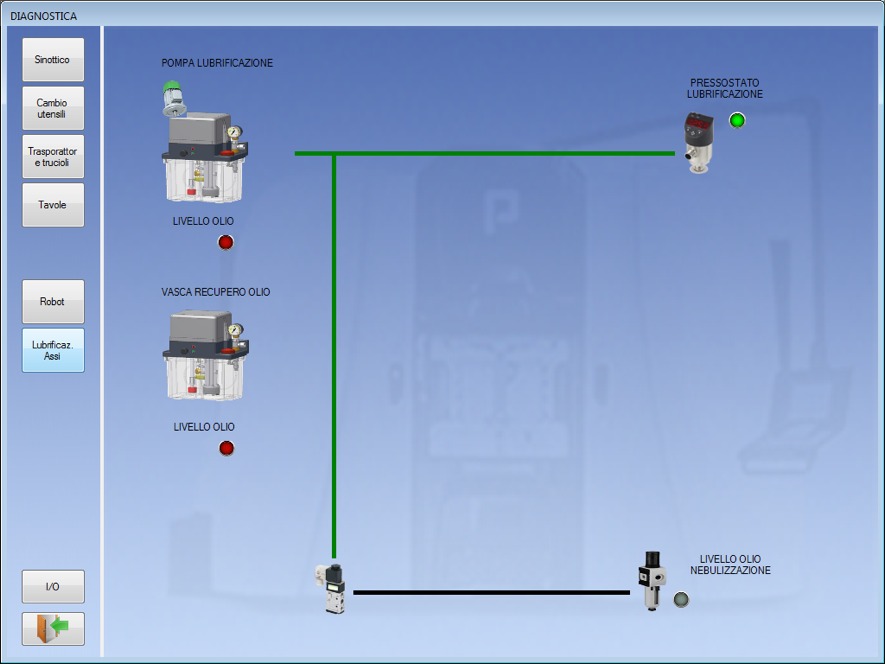
Furthermore, the operation of the pump and relative oil levels can be viewed.
TIME SETTING
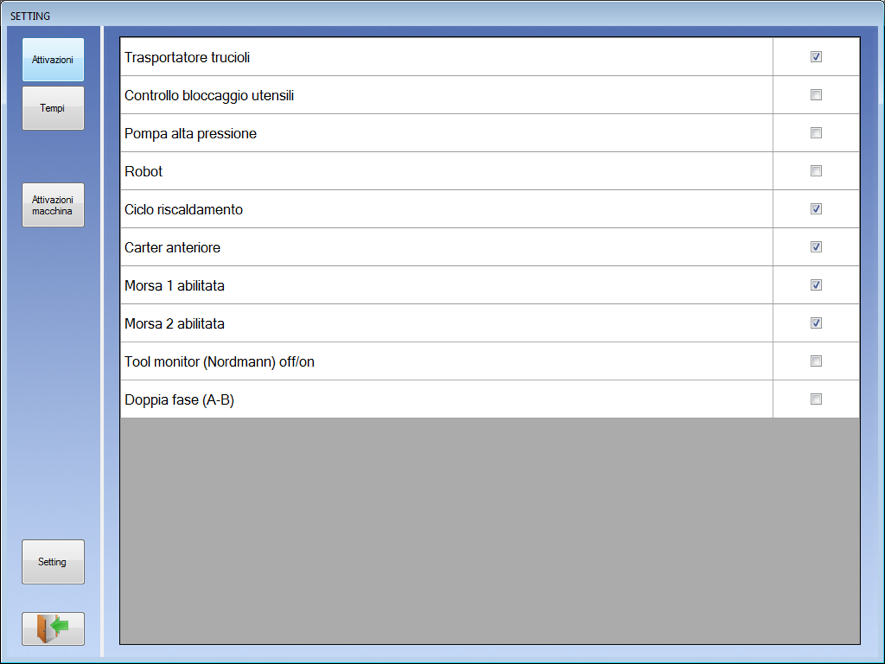
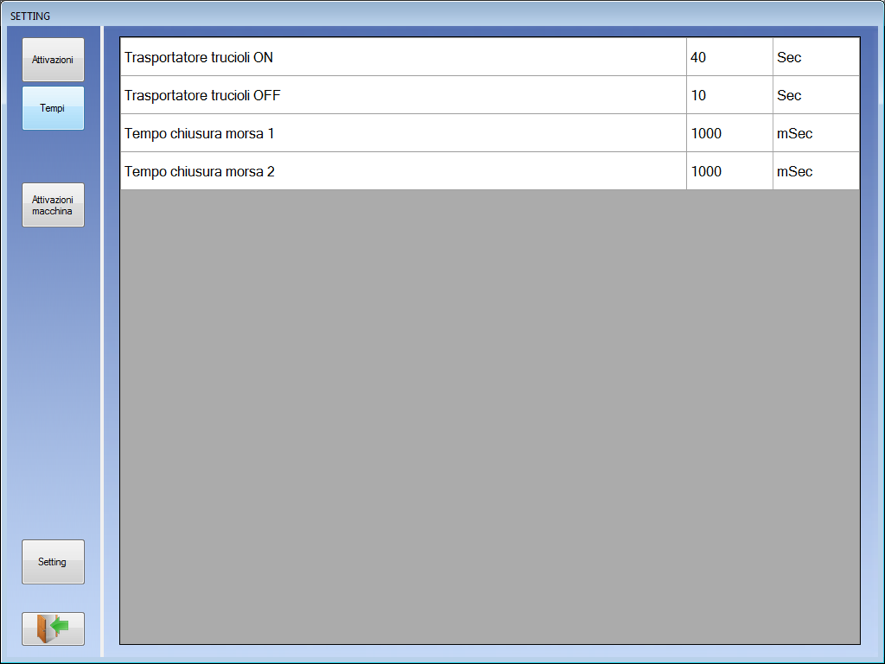
From the data collection, it emerged that when a production change is made, the operator often had to change, depending on the piece to be produced, some settings, such as the frequency of “stop and go” of the chip conveyor according to the type of chip produced, or the “Tool Monitor” (breakage of tools), or still enable the Double phase (AB) in case of piece produced in two phases (operations).
All these settings are now available on a page and are saved with the part program, so that the operator does not have to remember every time he changes the piece to adjust them and even in case of several operators and shifts, there is no lack of communication between operators that often causes damage.
… and to follow the sub-page where you can set the times for each element ..
SEARCH MANUAL INFORMATION
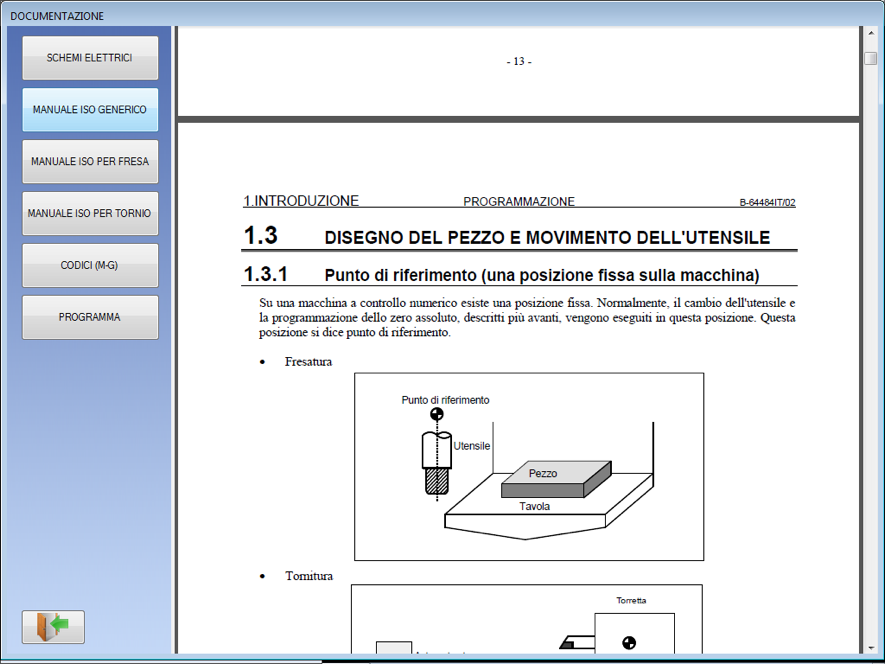
Another point that emerged from this data collection was the research by the operator of information on programming. For this reason we have made available the digital manual inside the interface: it is possible to consult it on screen, or to print the complete manual or just the part that interests you.
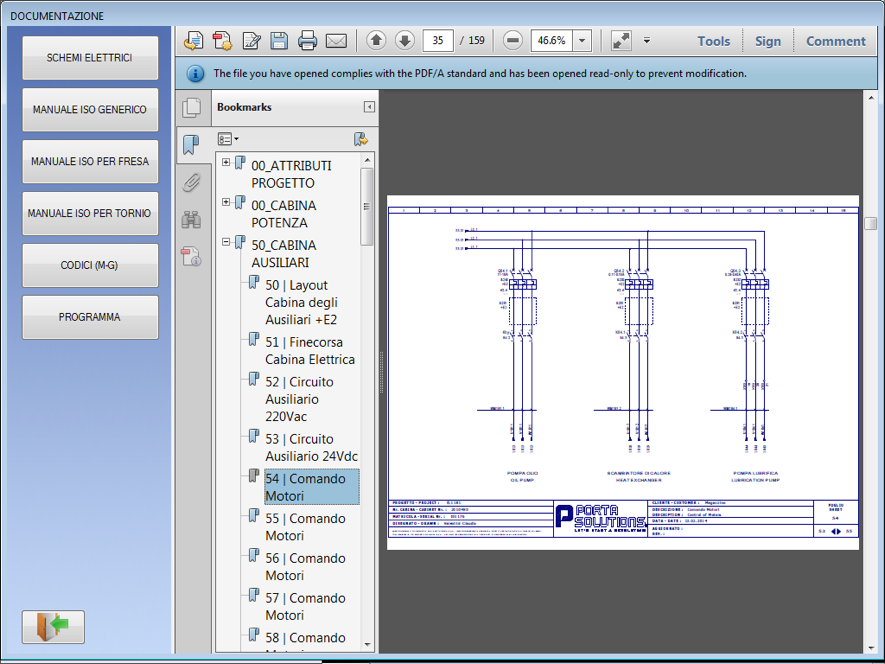
Also the various machine diagrams such as plumbing, electrical, and so on are all available in digital format. Following the example of the wiring diagram.
EVERYTHING SIMPLIFIED THROUGH A POWERFUL SYNOPTIC DISPLAY
With this method you saw that you do not need to waste time exploring around the machine to understand the status of the various elements but simply looking at the main panel of the machine standing with your feet glued in the same place.
The real icing on the cake is that all this information, since it is available on the panel, through an internet connection we can remotely and make it available to more people.
What do I mean? That if during the night shift an operator assigned only to loading and unloading the piece has problems and cannot overcome them because he is not trained for it, someone, through a computer or IPad remotely, can understand what is happening and guide the operator for the restart without having to physically go to the facility.
For years we have been offering the TELE-ASSISTANCE service to our customers, where in essence our specialized software can enter the machine logic and understand the status of the various elements to direct the customer to identify the cause.
GREATER MACHINE UNDERSTANDING
The goal was to design and implement a powerful interface that allows the customer to easily connect, without being a specialized software specialist, to the machine and understand the various states in the different areas of the machine, thus opening a new way: TELE-ASSITANCE FOR ALL!
OTHER NEW: WITH ALL THESE DIGITAL DATA AVAILABLE HERE’S THE MOST APPROVED PAGE!
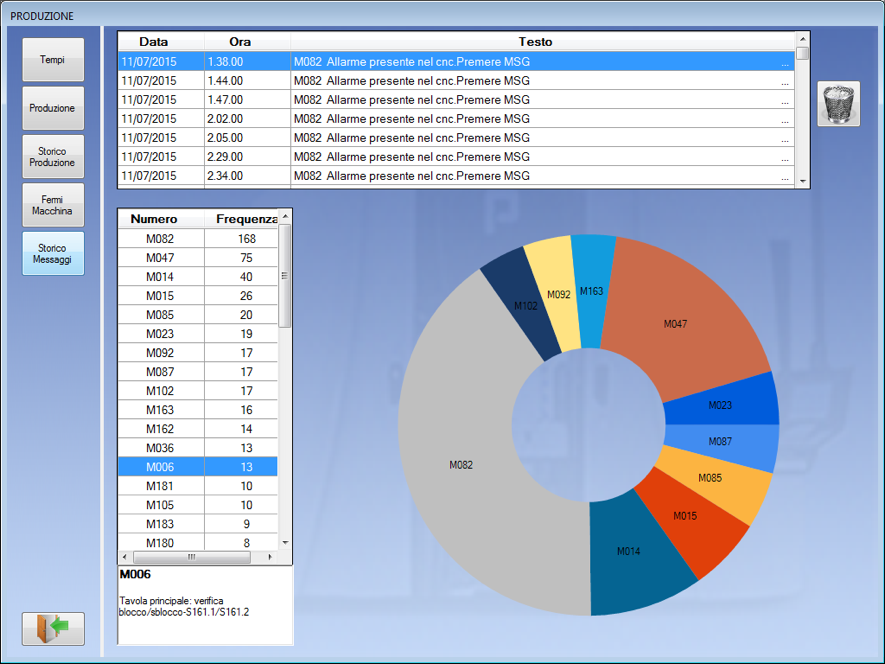
This page automatically collects all the digital data and automatically generates a report, complete with date, time and type of alarm, a sort of black box equal to that found on the aircraft.
The screen above helps in a concrete way to identify the missed production hours so as to focus on the main causes.
THE MULTICENTER TODAY HAS A POWERFUL INTERFACE TO SIMPLIFY THE USE
If you are curious and want to go into more detail with this topic, just enter your data below, so you receive the user manual as it is delivered to a customer who buys the MULTICENTER 3SPINDLES.
Maurizio Porta
Expert in Flexible Production

 Ita
Ita Deu
Deu
